
Industrial solar with storage: what the hybrid actually delivers
How much of an industrial PV plant's output really reaches the load, how to size storage against a roof, the difference between AC- and DC-coupled designs…
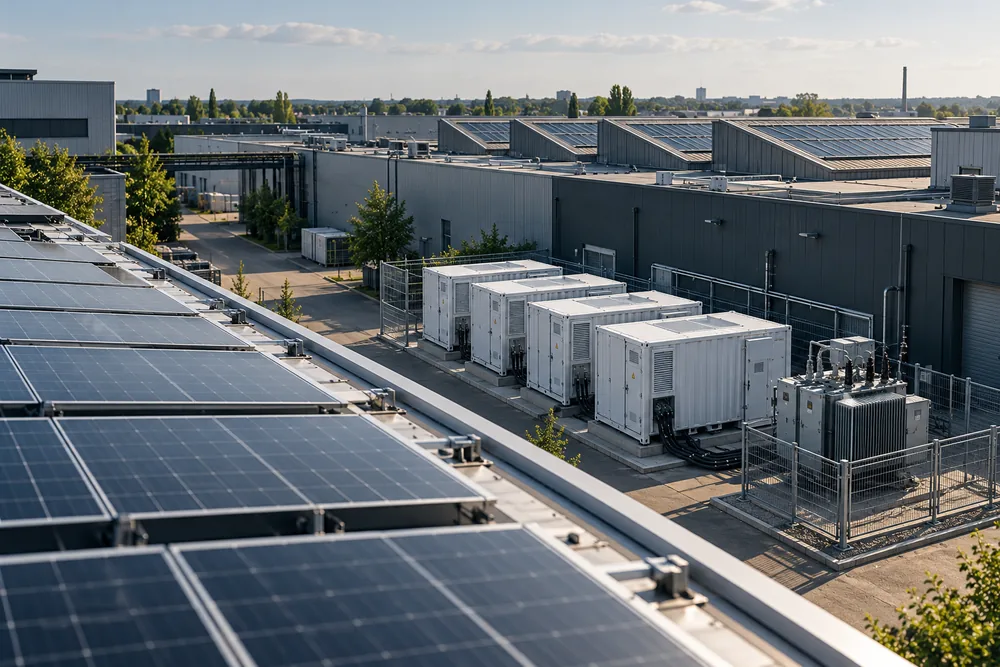
A rooftop PV plant peaks at midday; a factory consumes evenly from 08:00 to 18:00 and has an evening tail. Because of that mismatch, 30 to 60 % of what is generated goes to the grid at a price far below what you pay to buy it back. Storage closes precisely that gap.
Key parameters
Where half the yield goes
A concrete example: a factory roof, 500 kW of panels, annual yield around 550,000 kWh for central Ukraine. It looks like 550,000 kWh straight off the bill. In practice it is not.
At noon in July the array delivers 420 kW while the plant draws 260. The difference, 160 kW, goes to the grid. At 19:00 the array gives 40 kW and the plant draws 300, so 260 kW is bought at the full tariff. At weekends production stops and the sun shines just the same.
| Site profile | PV self-consumption without storage | What is lost |
|---|---|---|
| Three shifts, seven days | 70–85 % | a small summer surplus |
| One shift, five days | 40–55 % | evenings, nights and every weekend |
| Warehouse, office, retail | 50–65 % | the evening peak and winter mornings |
| Agriculture, seasonal load | 25–45 % | the whole off-season yield |
The spread between what you are paid for the surplus and what you pay in the evening is the economic case for storage alongside PV. It generates nothing; it moves energy a few hours forward, and each moved kilowatt-hour is worth that spread.
How much storage per kilowatt of panels
Working rule: 1 kWh of storage for every 1.5–2.5 kW of installed PV. For 500 kW of panels that is 200–330 kWh. The rule carries a condition that usually goes unmentioned: it assumes the array roughly matches the site's own consumption. Where the roof is larger than the demand — on a single shift it almost always is — that same ratio lifts self-consumption by only 10–15 percentage points, because a battery can absorb no more than its usable capacity in a day. The calculator below is built on exactly that arithmetic.
Which is why capacity is sized against the daily surplus, not the array rating:
- Take hourly PV output for a typical clear day (from the PV designer or PVsyst).
- Overlay the real hourly consumption logged on the LV board.
- Sum the hours where generation exceeds consumption — that is the daily surplus in kWh.
- Sum evening and night consumption until the next sunrise — that is where the surplus can go.
- Capacity = the smaller of the two, multiplied by 1.15 to allow for a 10–90 % SOC window.
The usual mistake is sizing on the peak summer surplus. Summer surplus is the largest and the least valuable: the tariff spread is narrower and the battery will idle in winter. Aiming at the shoulder-season surplus puts the system to work on more days of the year.
Converter rating is chosen separately, against the evening peak rather than the capacity. For the example above that is roughly 250–300 kW against 250 kWh — about 1C.
AC-coupled or DC-coupled
| AC-coupled | DC-coupled | |
|---|---|---|
| Topology | PV and storage each have their own inverter, meeting at 400 V | panels and battery share a DC bus behind one hybrid inverter |
| Round-trip efficiency | 2–4 % lower, double conversion | higher, charging stays on DC |
| Existing PV plant | works, nothing is rebuilt | inverters have to be replaced |
| Scaling | simple, add another block | limited by the inverter voltage window |
| Island operation | needs a grid-forming battery inverter | simpler to implement |
| Typical use | retrofitting an existing array | new-build PV + storage as one project |
In practice: if the PV plant already runs, it is AC-coupled and there is little to discuss. If PV and storage are designed together and the site has to island, cost both — the efficiency difference compounds over the life of the system.
Separately: island operation requires a grid-forming inverter that establishes frequency and voltage itself. An ordinary grid-following PV inverter shuts down when the grid disappears; that is mandatory anti-islanding protection, not a fault.
How the economics change
| PV only | + 250 kWh | + 500 kWh | + 1000 kWh | |
|---|---|---|---|---|
| Annual yield | ~550,000 kWh | |||
| Used on site | ~47 % | ~57 % | ~67 % | ~88 % |
| Exported | ~292,000 kWh | ~236,000 | ~180,000 | ~68,000 |
| kWh per kW of PV | — | 0.5 | 1.0 | 2.0 |
| What is added | — | evening peak shaving, backup during outages | ||
The table shows what brochures leave out: 85–95 % self-consumption on this roof costs a battery four times the rule-of-thumb size. Each further ten percentage points is dearer than the last, because the battery spends more of the year part-charged. The optimum is therefore almost never at maximum self-consumption — it is where the marginal cost of a kilowatt-hour of capacity meets the marginal saving.
A point worth stating plainly: storage almost always pays back more slowly than the PV plant itself. Panels are the cheapest way to obtain a kilowatt-hour; a battery is a way to make that kilowatt-hour available when it is needed. Together they save more money in absolute terms but show a worse simple payback than PV alone. If a supplier claims the battery pays back faster than the panels, ask how.
The second benefit does not fit in the table: once storage is installed the site stops halting during outages. For continuous processes that often outweighs the whole tariff saving — see the analysis of outage scenarios.
To size your own case, three things are needed: the PV yield or array rating, the hourly consumption profile and the tariff with its bands. All three are in the questionnaire, which takes about ten minutes.
How much solar reaches your load
The same roof with and without storage. Pick the closest consumption pattern — the exact answer comes from a logged daily profile.
Sensible range: the battery works on almost every day of the year.
Yield is taken as 1,100 kWh per installed kW per year, an average for central Ukraine. A battery can absorb no more than its usable capacity in a day, so the hint compares that against the daily surplus rather than against the array rating. The model assumes one cycle a day over 280 working days.
Frequently asked questions
How much storage does an industrial PV plant need?
How much does storage raise PV self-consumption?
AC-coupled or DC-coupled storage for solar?
Can the site run when the grid fails?
What pays back faster, solar or storage?
How long does storage last alongside a PV plant?
Figures shown are indicative. We supply the equipment and size the system; design, installation and commissioning are arranged through contractors when needed and quoted separately. Exact sizing follows a load-profile analysis.
Need equipment?
Request a quotation.
Send a model, specification or describe your requirements. We will clarify the configuration, check supply terms and prepare a price quotation.