
SOC in a BESS: what the charge level shows and how it drives cycle life
BESS SOC (State of Charge), DOD and SOH explained: optimal 10–90% operating window, battery degradation curves, calibration methods and lifecycle extension for LFP.
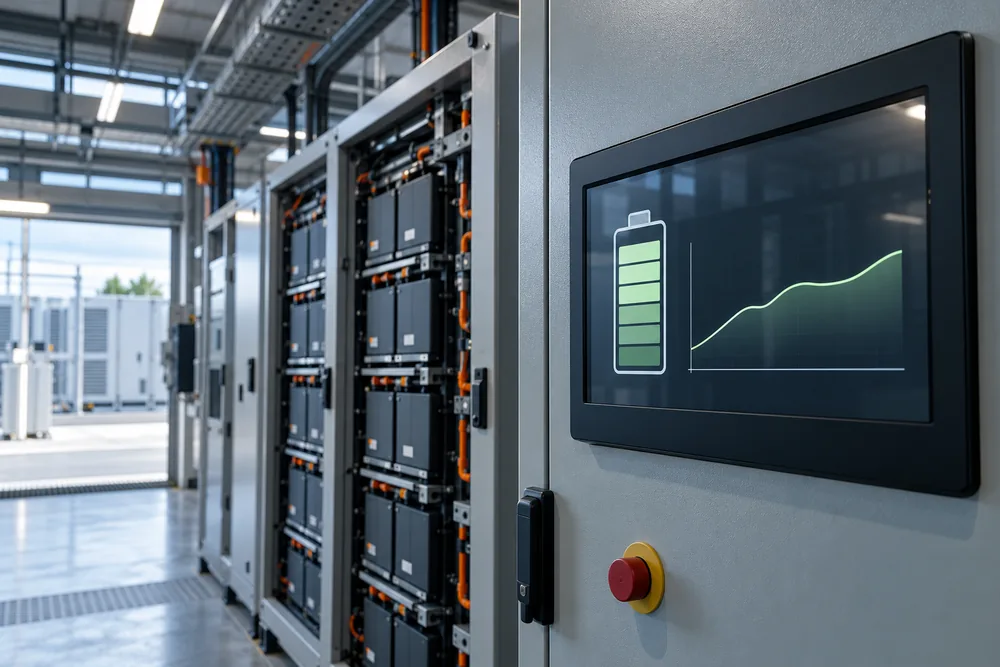
SOC (State of Charge) is the battery's charge level as a percentage of its nameplate capacity. Industrial storage almost never runs across the full 0–100 %: the usual window is 10–90 %, and that window is what decides how many years the system lasts.
Key parameters
What SOC means
SOC is "how much is left", as a percentage. 100 % means charged to the manufacturer's upper limit, 0 % means the lower one has been reached. Neither limit is set by the cell's physics — both are set by the BMS. Real lithium iron phosphate can be discharged deeper, but it will lose capacity quickly if you do.
One detail confuses everyone on first contact: SOC is not measured directly. The voltage of a LiFePO4 cell barely moves across the middle of its range — between 30 and 70 % charge the difference is a few tens of millivolts per cell. So the BMS counts SOC by integrating current (coulomb counting) and periodically re-references against voltage at the ends of the range, where voltage finally does move. Hence both the accumulated drift and the need for calibration.
SOC, DOD, SOH and C-rate are four different things
They get mixed up constantly in quotations, and they answer different questions.
| Metric | Question | Unit | Typical |
|---|---|---|---|
| SOC | How much charge right now? | % | 10–90 working window |
| DOD | How deep do we discharge? | % | 80 % in life ratings |
| SOH | How much capacity is left of new? | % | 100 → 80 over design life |
| C-rate | How fast do we charge/discharge? | C | 0.25–1.0C |
The practical link between them: cycle life is stated at a given DOD — "6000 cycles at 80 % DOD". Discharge only 50 % and you get substantially more cycles. Discharge 95 % and you get substantially fewer, possibly outside warranty. SOH is the result: how much capacity survived all those cycles.
Why the window is 10–90 rather than 0–100
Three reasons, none of them a vendor being cautious.
The top. Holding a cell near 100 % accelerates growth of the passivation layer on the anode. It is the slowest form of degradation and the least reversible. A system that charges to 100 % every night and sits there until morning loses capacity noticeably faster than one that stops at 90 %.
The bottom. Below roughly 10 % the cell voltage falls sharply, current for the same power rises and heating increases. The BMS also has its worst SOC estimate down there, so keeping a reserve is insurance against measurement error as well.
Margin for spread. In a rack of dozens of modules the cells are never identical. Balancing evens them out slowly, and between balancing sessions there is always a spread. A 10–90 window guarantees that even the weakest cell stays inside its limits when the average SOC still looks fine.
Which is why a specification should be read for usable capacity, not nameplate. A system with 400 kWh nameplate and a 10–90 % window delivers 320 kWh. If one quotation states nameplate and another states usable, the 20 % gap is not a discount — it is two different ways of counting.
How depth of discharge changes cycle life
Orders of magnitude for LiFePO4 at 25 °C and moderate C-rate. Exact figures live in the cell datasheet — what matters here is the shape of the relationship.
| Depth of discharge | SOC window | Cycles to 80 % SOH |
|---|---|---|
| 100 % | 0–100 | ~3000 |
| 90 % | 5–95 | ~4500 |
| 80 % | 10–90 | ~6000 |
| 60 % | 20–80 | ~9000 |
| 40 % | 30–70 | ~15000 |
The non-obvious design conclusion: it is sometimes cheaper to buy a larger battery and cycle it shallowly than a smaller one taken to the floor. If a site needs 200 kWh a day, a 250 kWh system runs at 80 % DOD and gives about six thousand cycles; a 400 kWh system runs at 50 % DOD and gives more than twice that. The purchase-price gap is often smaller than the service-life gap. That calculation is made through LCOS, not through dollars per kilowatt-hour.
Temperature matters just as much. Running at 40 °C instead of 25 °C roughly halves calendar life. Cooling is part of the economics, not an accessory.
SOC calibration: why, and how often
Coulomb counting accumulates error: every slightly mismeasured amp adds to the last. After a few months of working in the middle of the range, the gap between displayed and actual SOC can reach 8–10 %. For peak shaving that means the EMS either stops too early or hits the lower limit in the middle of a peak.
Calibration is one full controlled cycle: discharge to the lower limit, then charge to the upper one while recording the energy actually delivered and taken. The BMS re-references its count and produces a fresh SOH estimate at the same time. It is normally done every 3–6 months and always during commissioning — on a new system the first calibration cycle is the most important one.
If a system will sit idle for a long time, leave it at 40–60 %. That is the best storage state: no degradation from a full charge, and no risk of deep discharge from the electronics' own consumption.
How much energy you actually get
Nameplate capacity and usable capacity are different numbers. When comparing quotes, check which one is written.
Cycle counts are order-of-magnitude for LiFePO4 at 25 °C. Exact figures come from the cell datasheet: a manufacturer always states life at a specific DOD.
Frequently asked questions
What is SOC in a BESS?
How is SOC different from DOD?
Why not charge to 100 %?
What does SOH show?
How often should SOC be calibrated?
Why is usable capacity lower than nameplate?
What happens if a BESS is discharged to zero?
Figures shown are indicative. We supply the equipment and size the system; design, installation and commissioning are arranged through contractors when needed and quoted separately. Exact sizing follows a load-profile analysis.
Need equipment?
Request a quotation.
Send a model, specification or describe your requirements. We will clarify the configuration, check supply terms and prepare a price quotation.